In the high-stakes world of modern manufacturing, there is a ghost that haunts almost every shop floor. We call it the Invisible Factory.
Imagine walking through your facility. The lights are on, the machines are humming, and the operators are busy. To the untrained eye, everything looks perfect. But if you look closer at the data, not the activity you’ll find a parallel operation running alongside your real one. This invisible factory produces no sellable goods. Instead, it manufactures downtime, slow cycles, and scrapped parts.
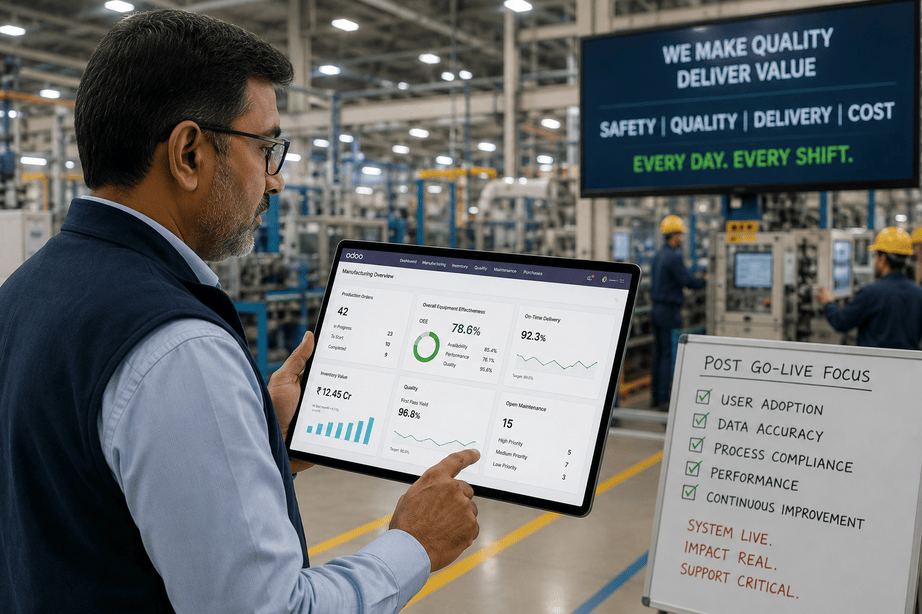
As a leader, your most expensive mistake isn’t necessarily buying the wrong machine; it’s failing to realize that the machine you already own is only working at a fraction of its potential. This is where Overall Equipment Effectiveness (OEE) moves from being a technical manufacturing metric to a critical strategic tool for the C-suite.
What is Meant by Overall Equipment Effectiveness?
At its simplest, Overall Equipment Effectiveness (OEE) is the gold standard for measuring manufacturing productivity. But don’t let the technical name fool you. For a CEO or a Director of Operations, OEE is a Profitability Compass.
It is a percentage that identifies the percentage of manufacturing time that is truly productive. An OEE score of 100% means you are manufacturing only Good Parts, as fast as possible, with no downtime. In the real world, this is a theoretical ideal, but the gap between your current score and that 100% represents pure, unadulterated opportunity.
OEE is the ultimate no-nonsense metric because it accounts for all losses on the shop floor. It doesn’t care if your machine was on for eight hours; it only cares about how much value was created during those eight hours.
The Anatomy of Efficiency: Overall Equipment Effectiveness in Manufacturing
To manage a factory effectively, you have to stop looking at output as a single number and start looking at the three levers that control it. OEE breaks manufacturing performance into three distinct categories: Availability, Performance, and Quality.
The First Lever: Availability (The Are We Running? Metric)
Availability considers all events that stop planned production for an appreciable length of time. We’re talking about equipment failures, unplanned maintenance, and the silent thief of productivity: long changeovers and setups.
When your availability is low, your capital is sitting idle. You are paying for the floor space, the insurance, and the labor, but the engine isn’t turning.
The Second Lever: Performance (The Are We Fast Enough? Metric)
This is where many leaders lose their grip on reality. Performance accounts for anything that causes the manufacturing process to run at less than the maximum possible speed.
Have you ever had an operator dial back a machine’s speed because it runs better that way or to avoid frequent jams? Those are micro-stops. Individually, they last only seconds. Collectively, they can steal 20% of your daily capacity without ever appearing on a traditional downtime report.
The Third Lever: Quality (The Is it Right the First Time? Metric)
Quality is the most painful loss. It accounts for manufactured parts that do not meet quality standards, including parts that require rework.
If you produce a defective part, you haven’t just lost the raw material. You’ve lost the time that machine spent making it time that could have been used to make a sellable product. You’ve effectively paid for a machine cycle that yielded zero ROI.
The Math of Reality: The Overall Equipment Effectiveness Formula
Many managers make the mistake of averaging their performance across these three categories. Don’t do that. OEE is a multiplicative metric, which is exactly why it is so revealing (and often so humbling).
The Overall Equipment Effectiveness formula is:
OEE = Availability * Performance * Quality
Because you are multiplying the percentages, any weakness in one area drastically pulls down the entire score. This is a mathematical reflection of the bottleneck reality: a factory is only as good as its weakest link.
How is OEE Calculated?
To calculate your score, you need three simple ratios:
- Availability Ratio: (Actual Run Time / Planned Production Time)
- Performance Ratio: (Ideal Cycle Time * Total Count) / Run Time
- Quality Ratio: (Good Count / Total Count)
When you multiply these three, you get your OEE.
A Deep Dive: An Overall Equipment Effectiveness Example
Let’s step out of the boardroom and onto the floor of an electronics assembly plant to see how this plays out in a standard 8-hour shift.
- Shift Length: 8 hours (480 minutes).
- Breaks: Two 15-minute breaks and a 30-minute lunch (60 minutes total).
- Planned Production Time: 420 minutes.
The Reality of the Day:
- Availability: The line experienced a 40-minute breakdown and 20 minutes of slow changeovers.
- Actual Run Time: 360 minutes.
- Availability Score: 360 / 420 = 85.7 %
- Performance: The line is designed to produce 10 units per minute. In the 360 minutes it ran, it should have produced 3,600 units. However, due to several micro-stops, it only produced 3,000 units.
- Performance Score: 3,000 / 3,600 = 83.3 %
- Quality: Out of those 3,000 units, 150 were found to be defective.
- Quality Score: 2,850 / 3,000 = 95 %
The Final OEE Calculation:
0.857 * 0.833 * 0.95 = 67.8 %
To the plant manager who only looks at the Good Count, the day looked okay. But to the leadership team, that 67.8% is a wake-up call. It means that for nearly 32% of the day, your multimillion-dollar investment was essentially a paperweight.
Benchmarking Success: What Does 85% OEE Mean?
If you calculate your OEE for the first time and find it is between 60% and 70%, don’t panic. You are in good company. Most average manufacturing facilities operate in this range.
However, in the industry, we talk about World-Class OEE, which is pegged at 85%.
Why 85%?
You might wonder why we don’t aim for 100%. In a practical business environment, 100% is a dangerous goal. It often implies that you aren’t doing enough preventive maintenance or that your Ideal Cycle Times are set too low.
What does 85% OEE mean in practice?
- Availability: 90% (World-class maintenance and lightning-fast changeovers).
- Performance: 95% (The machines run at their engineered speeds with almost no micro-stops).
- Quality: 99% (Waste is virtually non-existent).
The Leadership Strategy: Stop Managing Numbers, Start Managing Losses
As a business leader, your job isn’t to calculate the OEE it’s to act on what the OEE reveals. The true power of this metric lies in Loss Analysis.
When you see your OEE score, your first question shouldn’t be How do we make that number go up?” It should be, Which of the three levers is dragging us down?
- If Availability is the problem: You have a process and maintenance issue. You need to look at SMED (Single-Minute Exchange of Die) to speed up setups or invest in predictive maintenance to stop breakdowns before they happen.
- If Performance is the problem: You have a training or technical issue. Your operators might need better standard operating procedures, or your machines might need a technical tune-up to reach their designed speeds.
- If Quality is the problem: You have a material or precision issue. You need to look at your supply chain or your internal quality control checkpoints.
The ROI of Reclaiming the Invisible Factory
Why does this matter for the bottom line? Let’s look at the Hidden Cost of CAPEX.
When a company sees its production capacity maxed out, the standard move is to buy more equipment. This is a massive capital expenditure (CAPEX) that comes with increased interest, depreciation, and labor costs.
But what if, instead of buying a second line, you improved your OEE on the first line from 65% to 80%? That 15% jump is free capacity. You’ve already paid for the machine, the floor space, and the lighting. Every extra unit produced through OEE improvement has a significantly higher profit margin than a unit produced on a new, expensive line.
Operational excellence is the most cost-effective way to scale.
Conclusion: Turn the Lights On
The Invisible Factory only exists in the dark. It thrives on gut feelings, anecdotal reports from the shift leads, and spreadsheets that only track the final output.
By implementing a rigorous OEE mindset, you are essentially turning the lights on. You are moving from a reactive culture where you wonder why you missed your targets to a proactive culture where every minute of production is measured, managed, and maximized.
Before you look at next year’s budget for new equipment, take a hard look at your OEE. You might just find that the growth you’re looking for is already sitting right there on your shop floor, waiting to be reclaimed.
The most profitable capacity is the capacity you’ve already bought you just have to turn it on.